Cycling power data: how to analyse more than average watts
Combine average and normalized power, VI, your power curve, IF and TSS to turn cycling files into useful training decisions.
Listen to this article
You can accumulate months of power, heart-rate and cadence data and still make decisions from one number. Average power summarizes work, but it does not show when you coasted, how much surges mattered or which duration improved on your curve.
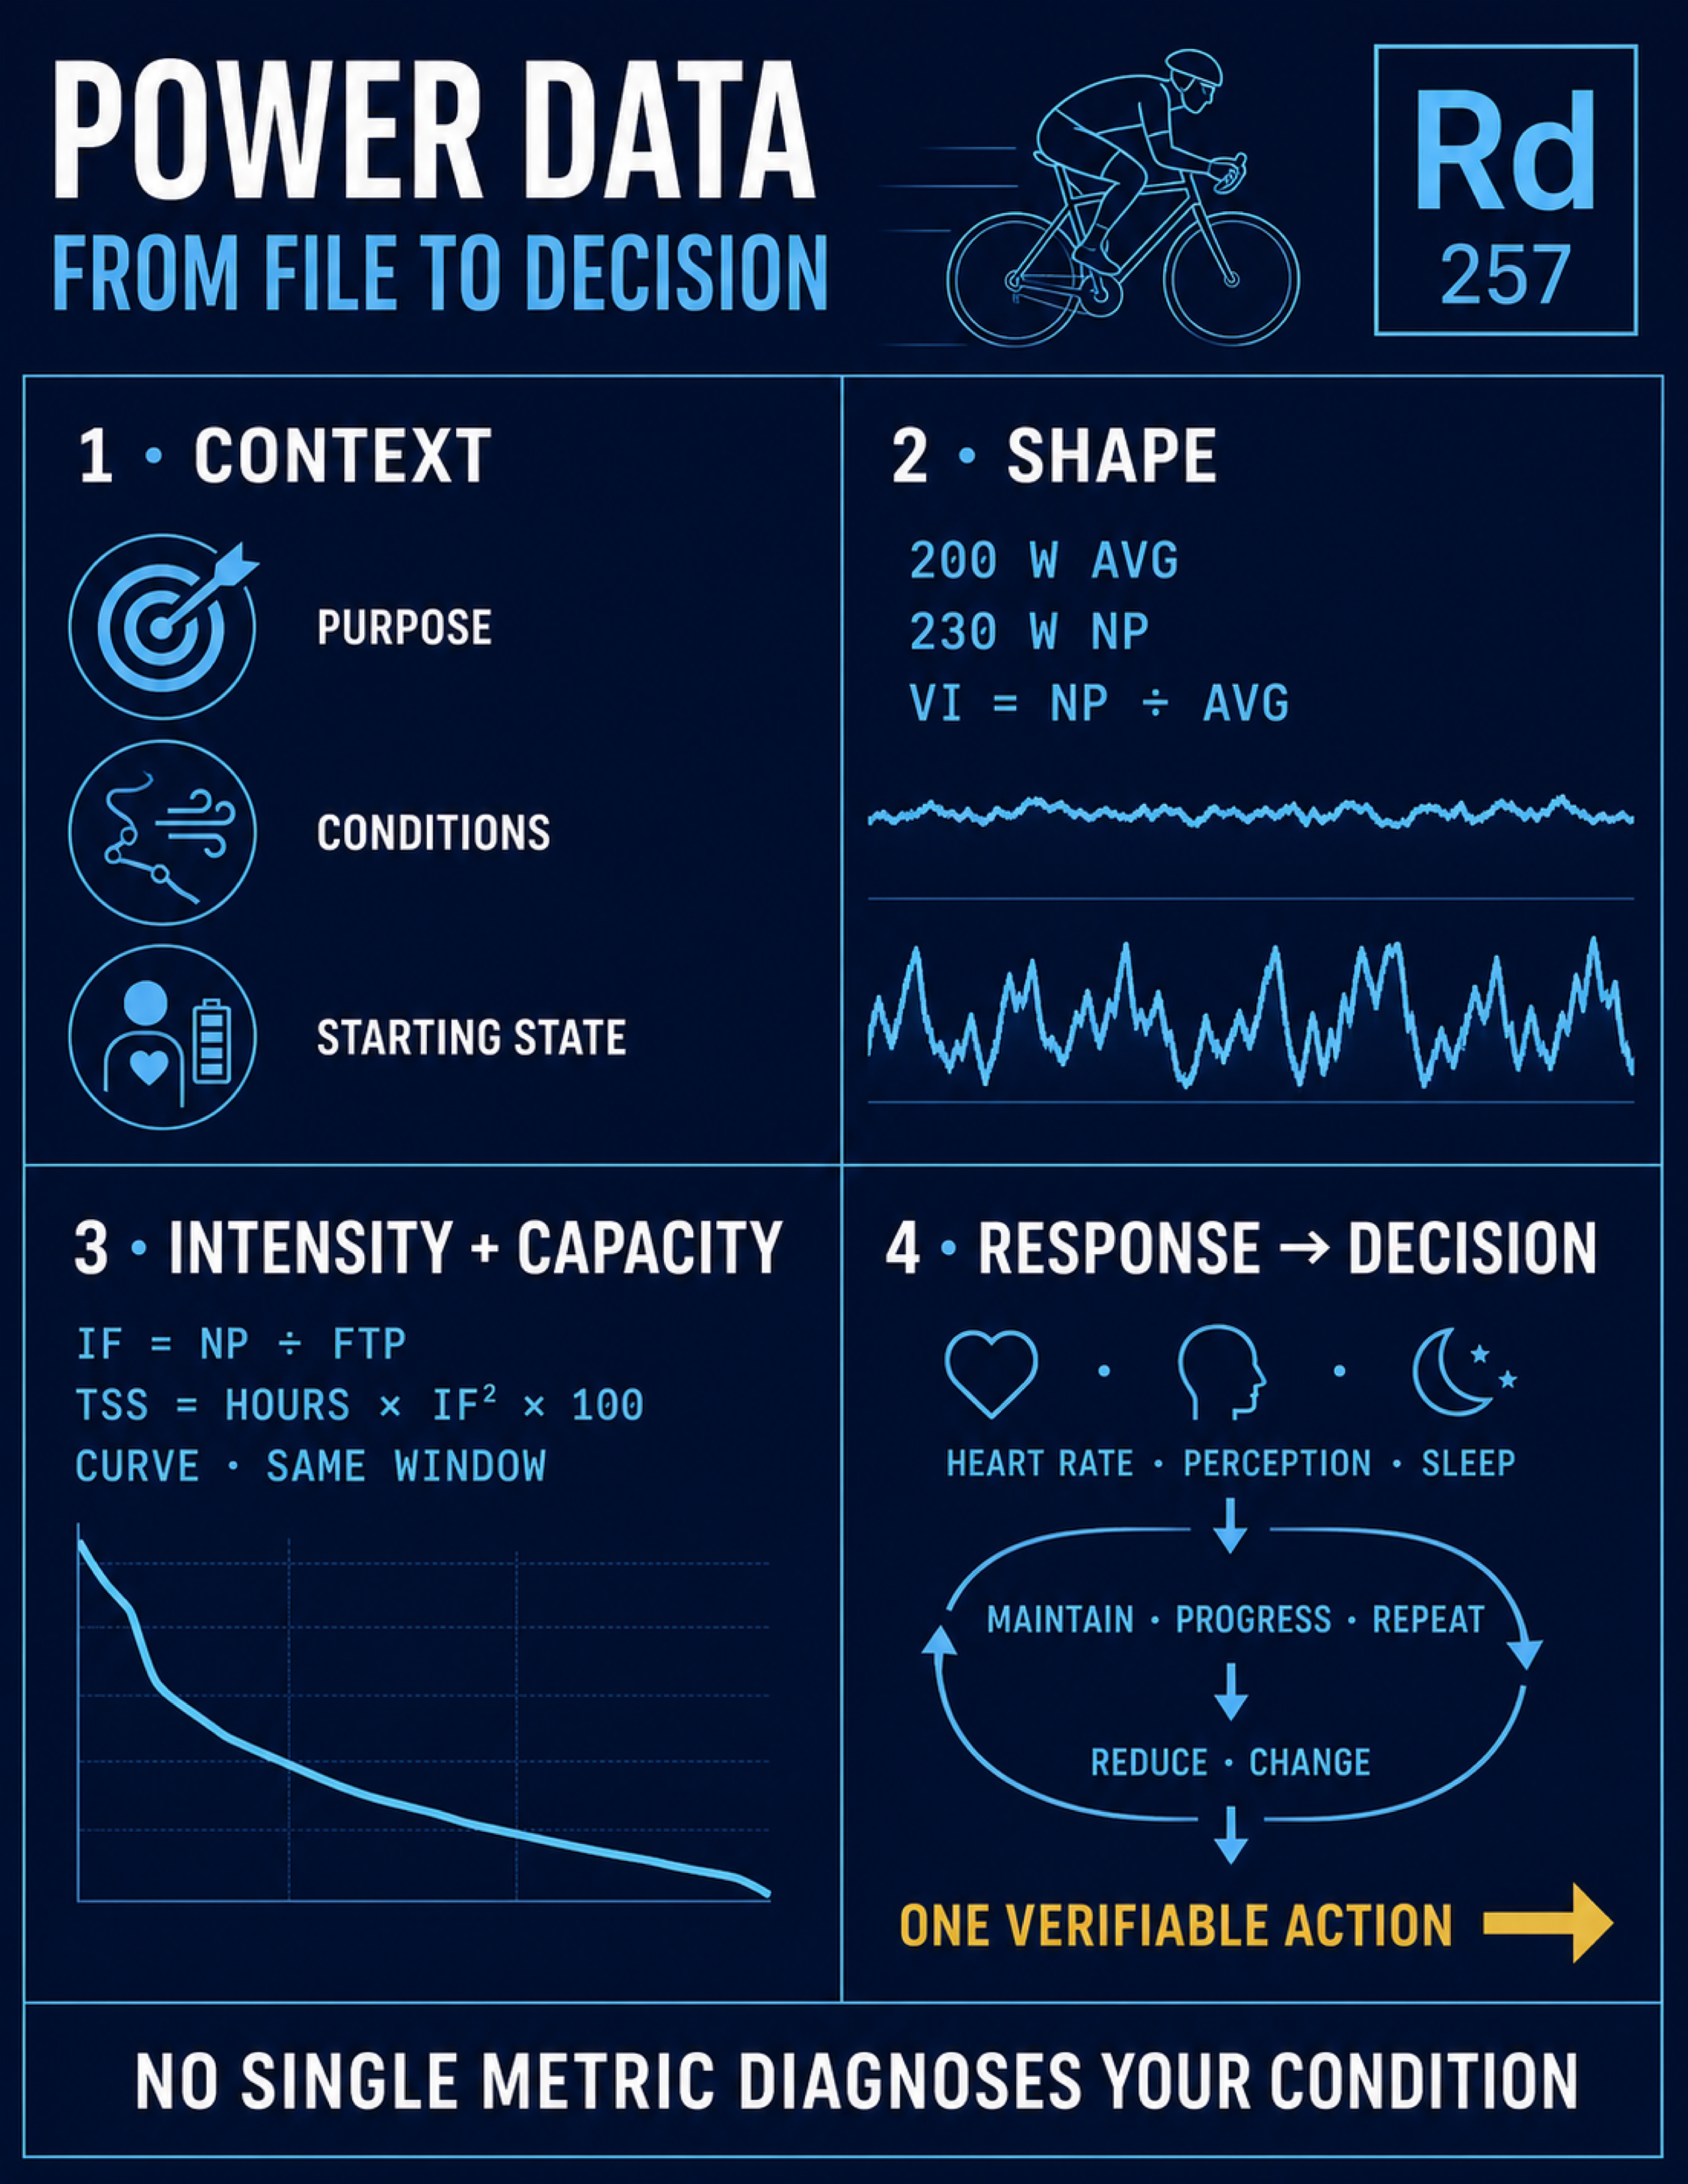
The direct answer is to analyse every file in layers. Start with purpose and conditions. Compare average and normalized power. Add VI, IF, TSS and the session distribution. Review your power curve over a comparable window. Then finish with one specific decision. No single metric diagnoses your condition.
Why average power is not enough
Two rides can both finish at 200 W average and represent different work. One may contain ninety steady endurance minutes. Another may alternate coasting, accelerations, climbs and turns on the front. The average spreads everything across time and loses the shape of the session.
The difference is not only mathematical. Kolsung and colleagues compared constant and variable efforts matched for average power in fifteen elite competitive cyclists. The response depended on intensity and the pattern of variation; clearer physiological differences appeared when fluctuations crossed lactate threshold.[1] The study cannot assign a universal penalty to every surge, but it shows why matching the average does not guarantee matching the demand.
Average power remains useful. It describes sustained external work and helps compare steady efforts. The mistake is asking it to explain a race, group ride or interval session on its own.
What normalized power adds
Normalized Power is a model designed to give greater weight to intense sections of a variable session. TrainingPeaks describes it as an estimate of the constant power that might represent a similar physiological demand.[2]
It is not a direct measurement of lactate, oxygen uptake, glycogen or muscle damage. It is a calculated metric. It can summarize variable riding, but it still needs duration, intensity distribution, context and internal response.
If a ride ends at 200 W average and 230 W normalized, the intense sections carried more weight than the average suggests. If both numbers are close, the effort was steadier within this model. Neither result tells you whether execution was good: a time trial seeks stability, while intervals require variation.
VI describes shape, not quality
The Variability Index, or VI, relates the two metrics:
VI = normalized power ÷ average power
TrainingPeaks defines VI with that ratio.[3] A value near 1.00 means that the two figures are close; a larger value indicates more variability as summarized by the model.
There is no universal cutoff that makes 1.05 good or 1.20 bad. Purpose determines the reading:
| Session type | Useful reading of variability | Decision question |
|---|---|---|
| Steady endurance | A low VI is usually coherent | Did the ride remain easy and controlled? |
| Intervals | A higher VI may be intentional | Do the spikes match the repetitions? |
| Group ride or race | Terrain and tactics increase variation | Did the surges compromise the finish? |
| Recovery | Low VI and low absolute power both matter | Did recovery drift into tempo? |
How to read your power curve without inventing diagnoses
The power curve collects your best mean power for different durations: seconds, minutes and prolonged efforts. It can reveal where performance changed, but it does not assign one exclusive energy system to each point.
Leo and colleagues recommend building a profile from appropriate maximal efforts, combining testing with training or competition data and choosing a model that fits the question. They also warn that the result changes with the data available.[4]
That is why rigid equivalences such as “five minutes equals VO₂ max” or “twenty minutes equals FTP” should be avoided. Those durations can inform related abilities, but each effort combines aerobic and anaerobic contribution, technique, pacing, motivation and fatigue.
Compare equivalent windows
To judge whether a block produced an improvement:
- use the same power meter and processing rules;
- compare windows of similar length;
- confirm that both contain real opportunities for maximal efforts;
- review the range you specifically trained;
- look for repeatability, not one isolated record.
If your best twenty-to-forty-minute power rises after a threshold block, the result is consistent with an improvement in that range. If one-to-five-minute power does not move, you may lack a specific stimulus, but you may also lack a fresh effort that reveals the capacity. The curve records what you demonstrated, not everything you could do.
A lower curve does not prove overtraining either. Missing recent tests, terrain, heat, a device change, a fatigued week or a real loss of form can all contribute. Persistent fatigue requires a trend read alongside execution, perception, recovery and context.
IF and TSS: relative intensity and calculated load
The Intensity Factor, or IF, divides normalized power by your FTP:
IF = normalized power ÷ FTP
An IF of 0.75 means normalized power was 75% of the configured FTP. TrainingPeaks publishes typical ranges for different sessions, but they are practical references rather than universal physiological boundaries.[5]
Duration changes the interpretation completely. An IF above 1.00 is possible for short efforts. Holding it near one hour may indicate an exceptional performance or stale FTP settings; it does not mean you sustained an intensity above your capacity indefinitely.
Training Stress Score, or TSS, combines duration and IF. In its simplified power-based form:
TSS = hours × IF² × 100
Three hours at 0.75 IF produce about 169 TSS, while ninety minutes at 0.95 IF produce about 135 TSS. Those numbers are correct within the model, but they do not describe the same stimulus or guarantee the same recovery.
There is no weekly TSS range that is high or safe for everyone. The consensus on athlete-load monitoring recommends combining external and internal load, individualizing interpretation and observing the athlete's response.[6] Compare load with your own history, available recovery and the quality of the sessions that matter.
What to review in an interval session
An interval file reveals more than the block average. Review:
- average or normalized power for each repetition, depending on its duration and variability;
- actual time within the target;
- pacing at the start and finish of each effort;
- recovery between repetitions;
- heart rate, perceived exertion, cadence and technique;
- the quality of the final repetition compared with the first.
A progressive decline may mean that you started too hard, recovered too little, arrived fatigued, overheated or chose an excessive target. No universal percentage identifies the cause. The useful signal is a repeated loss of quality relative to the session's purpose.
Self-report matters too. A systematic review found that subjective measures of wellbeing consistently responded to acute and chronic load, often more sensitively than several objective measures used alone.[7] Empty legs, poor sleep or unusual perceived effort do not replace power; they help interpret it.
A review order that ends in a decision
After a session, follow this sequence:
- Context. What was the goal? How did you arrive? What changed because of terrain, weather or the group?
- Shape. Read average and normalized power, VI, distribution and relevant intervals.
- Intensity and load. Read IF and TSS with current FTP and alongside duration.
- Capacity. Compare the curve only across windows with similar opportunities.
- Response. Add heart rate, perception, sleep, soreness and the quality of the next session.
- Decision. Maintain, progress, repeat, reduce or change the stimulus; write down which data will confirm the adjustment.
A power meter is not a speedometer. It is not an automatic laboratory diagnosis either. It records external work accurately. Analysis begins when you connect data, context, response and decision.
Keep three rules: compare equivalent sessions, treat NP, VI, IF and TSS as models rather than direct physiological facts, and require every review to end in a verifiable action. That is where collecting numbers becomes training with information.
References
- Physiological Response to Cycling With Variable Versus Constant Power Output — Frontiers in Physiology, 2020↩
- Normalized Power, Intensity Factor and Training Stress Score — TrainingPeaks↩
- Glossary of TrainingPeaks Metrics — TrainingPeaks↩
- Power Profiling and the Power-Duration Relationship in Cycling: A Narrative Review — European Journal of Applied Physiology, 2022↩
- Normalized Power, Intensity Factor and Training Stress Score — TrainingPeaks↩
- Monitoring Athlete Training Loads: Consensus Statement — International Journal of Sports Physiology and Performance, 2017↩
- Monitoring the Athlete Training Response: Subjective Self-Reported Measures Trump Commonly Used Objective Measures — British Journal of Sports Medicine, 2016↩
labels.help_guides_eyebrow
labels.help_guides_title
labels.help_guides_description
Configure and review your FTP and power zones
Set the right reference in Intervals.icu, sync it, and check exactly which FTP and zones Ridium is using.
Turn on and read the morning readiness email
Opt in to a morning readiness verdict on workout days, choose your send hour, and understand what drives the recommendation.
Visual summary
The article at a glance
Review the key concepts in one infographic.