Análise de temporada
Descubra o que realmente construiu sua forma — uma análise multi-ano de carga, intensidade e picos que transforma temporadas inteiras de arquivos de pedais em decisões para a próxima.
Seu histórico, finalmente legível
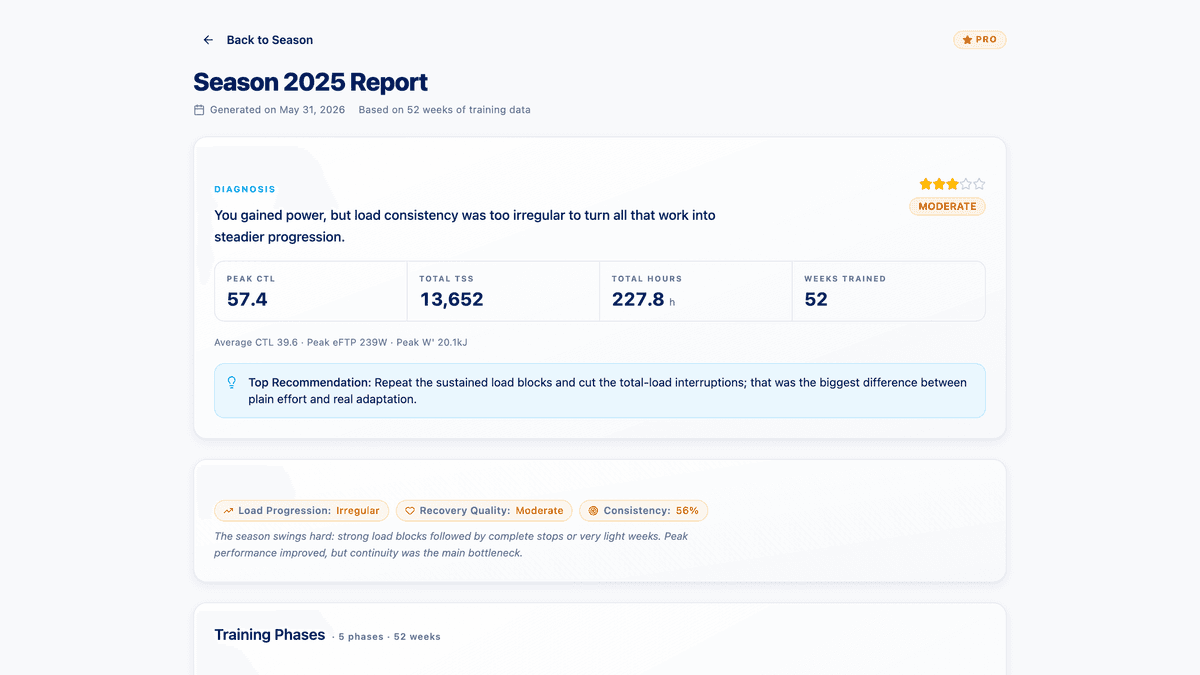
Métricas calculadas de forma determinística, narrativa escrita pelo analista de IA. Evidência, não achismo.
Seu histórico, finalmente legível
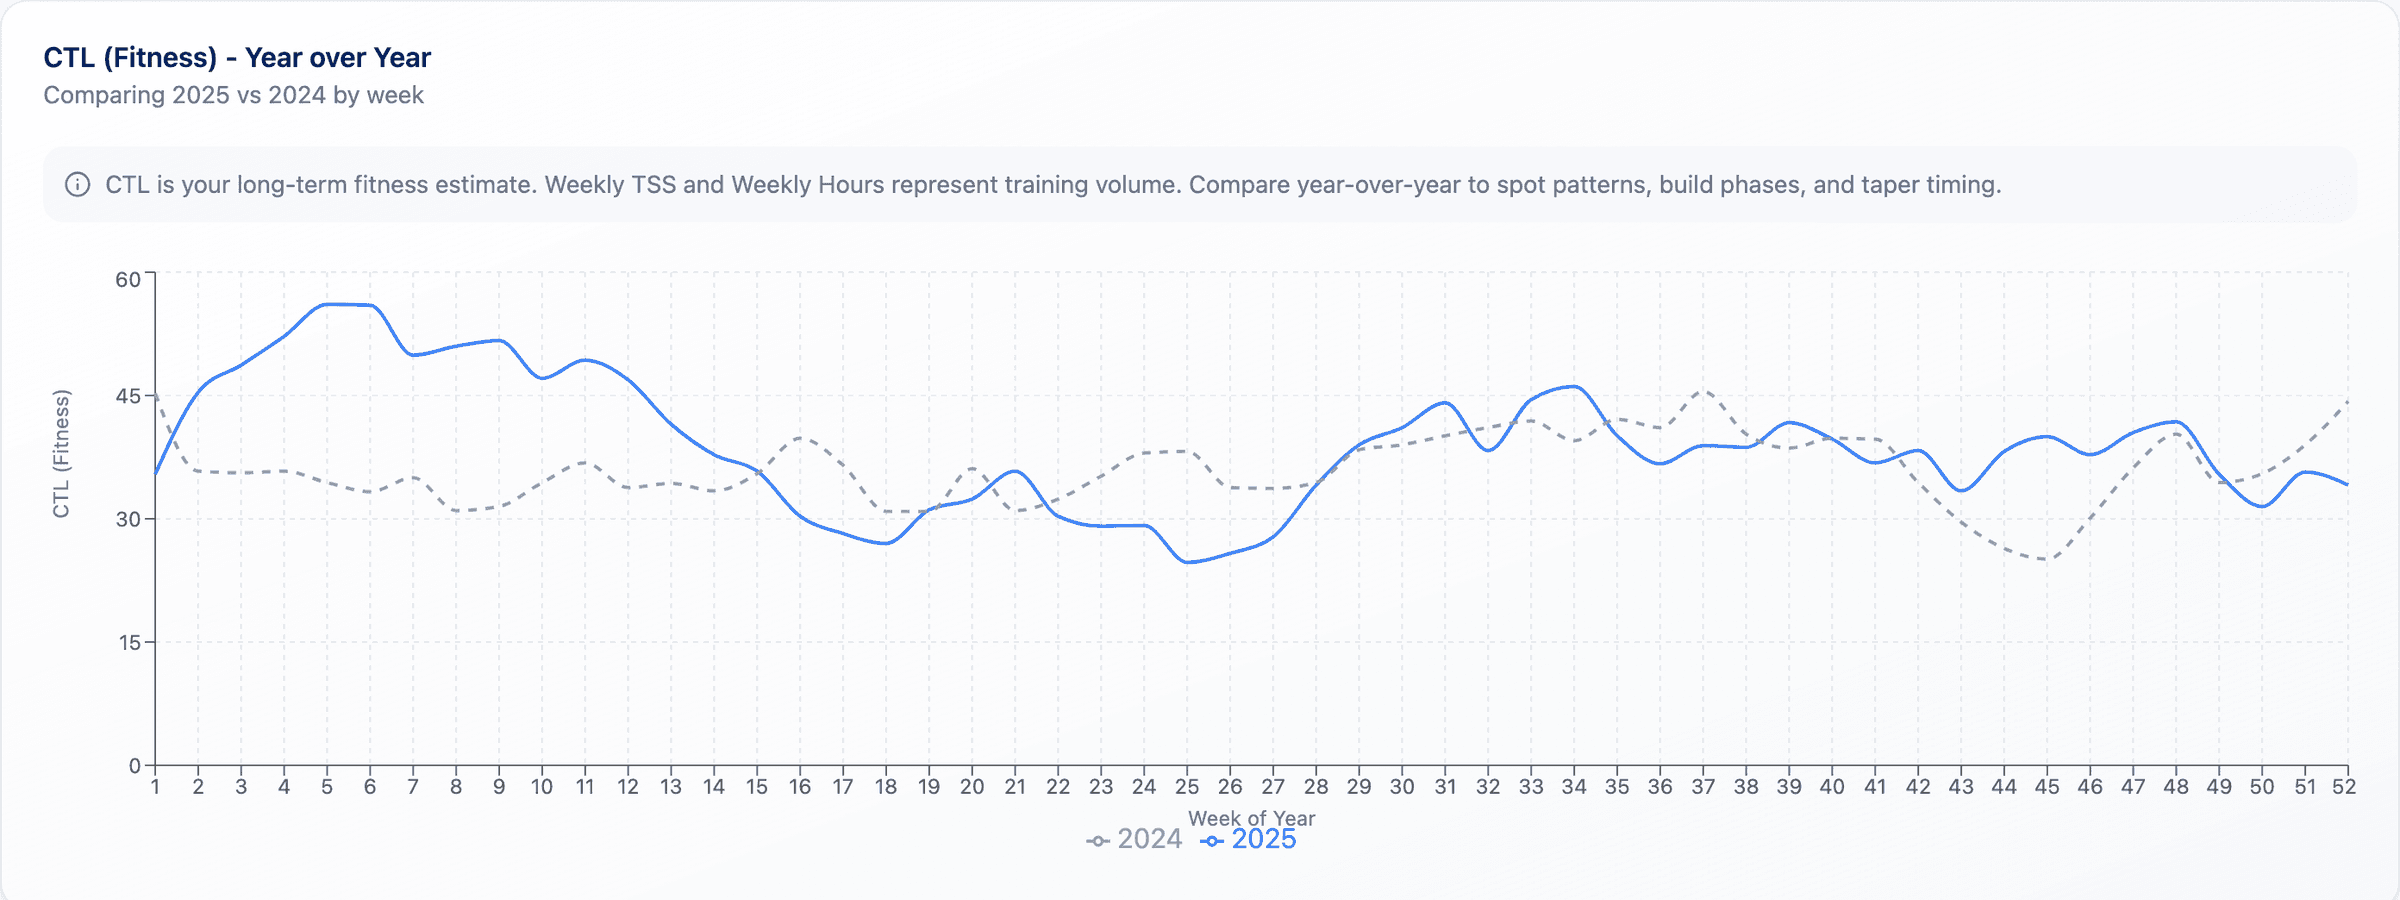
Forma (CTL), fadiga e frescor plotados ao longo de temporadas inteiras, explicados em linguagem clara pelo analista de IA.
Compare temporadas lado a lado
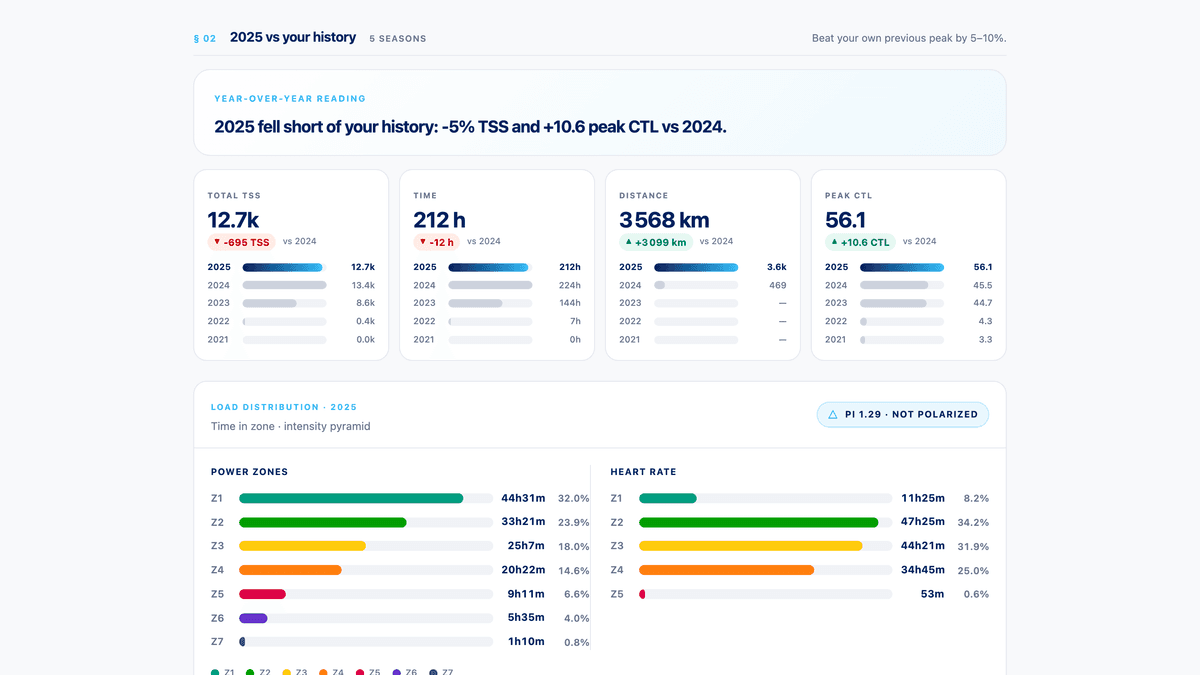
Volume, distribuição de intensidade e timing dos picos ano a ano — saiba num piscar de olhos se você está à frente do ano passado.
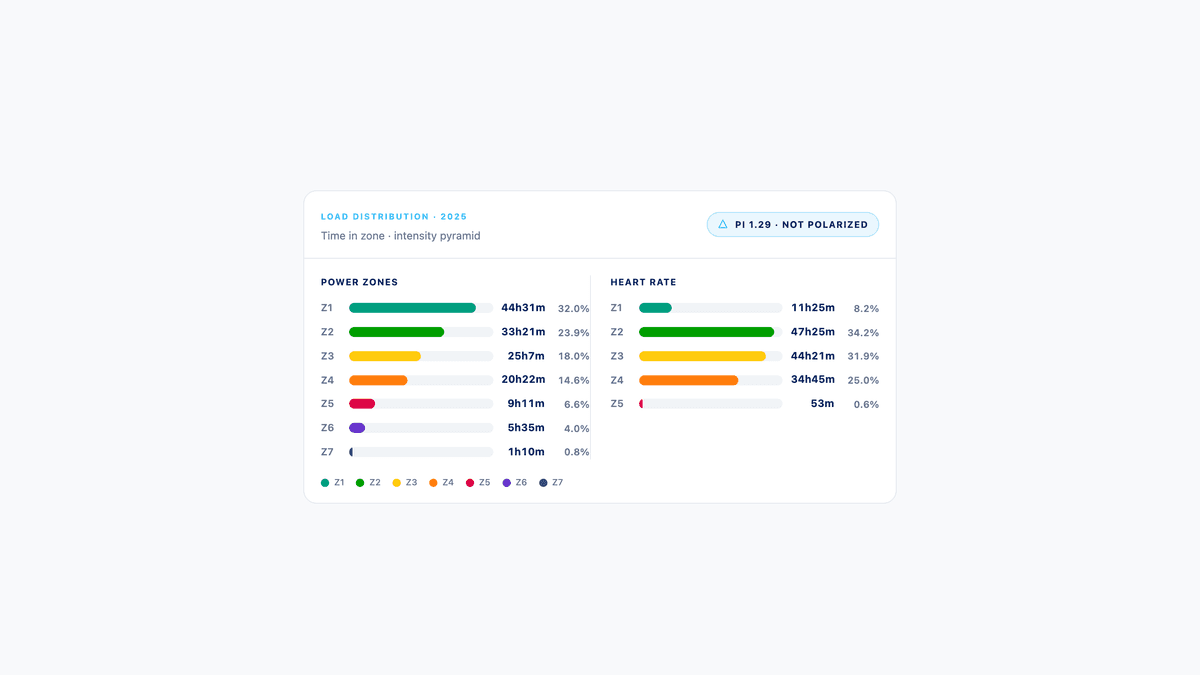
A verdade sobre sua distribuição de zonas
Quanto tempo você realmente passou em cada zona por temporada — polarizado no papel vs. polarizado na prática.
Picos explicados
Quando você atingiu seu pico, o que o precedeu e como reproduzi-lo (ou evitar a queda que veio depois).
Alimenta seu próximo plano
O planejamento de temporada parte desta análise, então o plano é construído sobre evidência, não sobre achismo.
Comparação ano a ano
Volume e intensidade por temporada, além da distribuição real de zonas — com dados de demonstração de um único atleta fictício.
Passo a passo
Os mesmos passos que você vai encontrar no guia de ajuda.
Assine o Pro e abra a Analítica. A análise multi-ano faz parte do kit Pro.
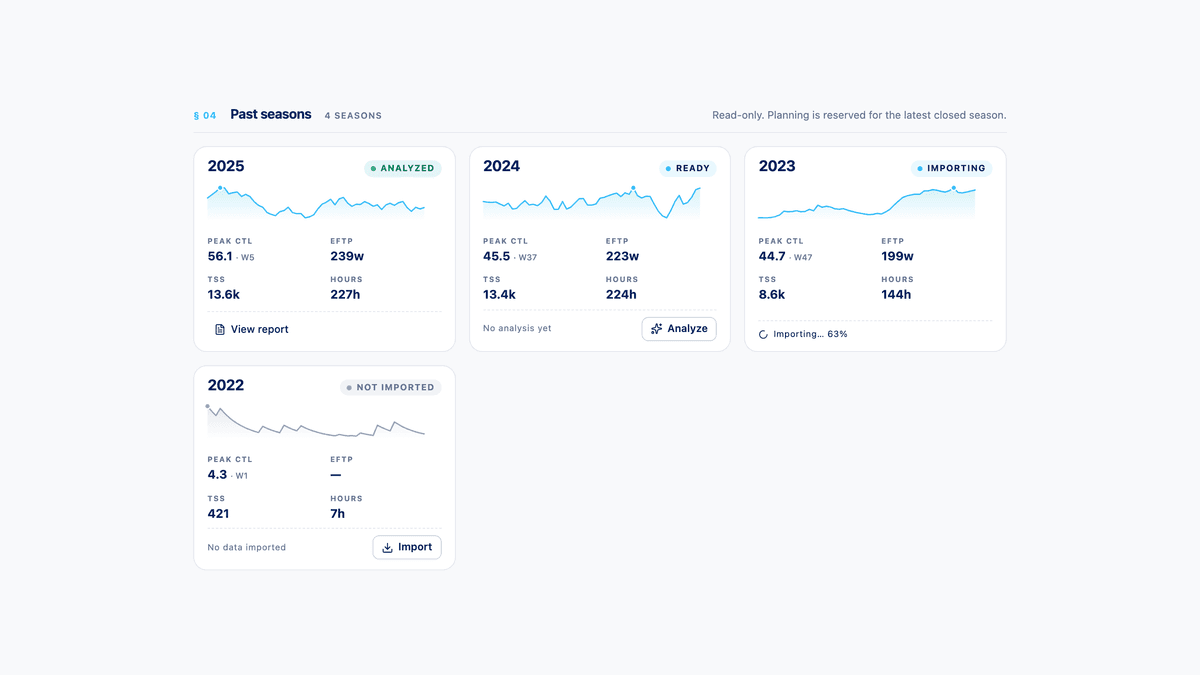
Escolha uma temporada — o Ridium ingere sob demanda o bem-estar diário e as atividades daquele ano (temporadas antigas também, uma de cada vez).
Leia o relatório de análise: progressão de carga, consistência, distribuição de zonas, picos e a narrativa do analista com recomendações.
Compare contra outras temporadas ingeridas (visão ano a ano).
Inicie uma conversa de planejamento a partir da análise para transformar as conclusões no plano da próxima temporada.
Capturas de tela
Telas reais do produto, capturadas com dados de demonstração.
Antes de começar
Até onde ele consegue voltar?
E se uma temporada só tiver dados do Strava?
A análise é automatizada ou escrita pela IA?
O que ela tem de Pro?
Posso rodar uma análise de novo?
Pare de treinar
no feeling.
Assine o Pro e descubra o que realmente construiu sua forma — temporada a temporada, com evidência.